19 Jan

The challenge developers face when debugging IoT devices is far greater than what regular software engineers face. Most software engineers will be working with servers or desktops that have a consistent internet connection and plenty of storage.
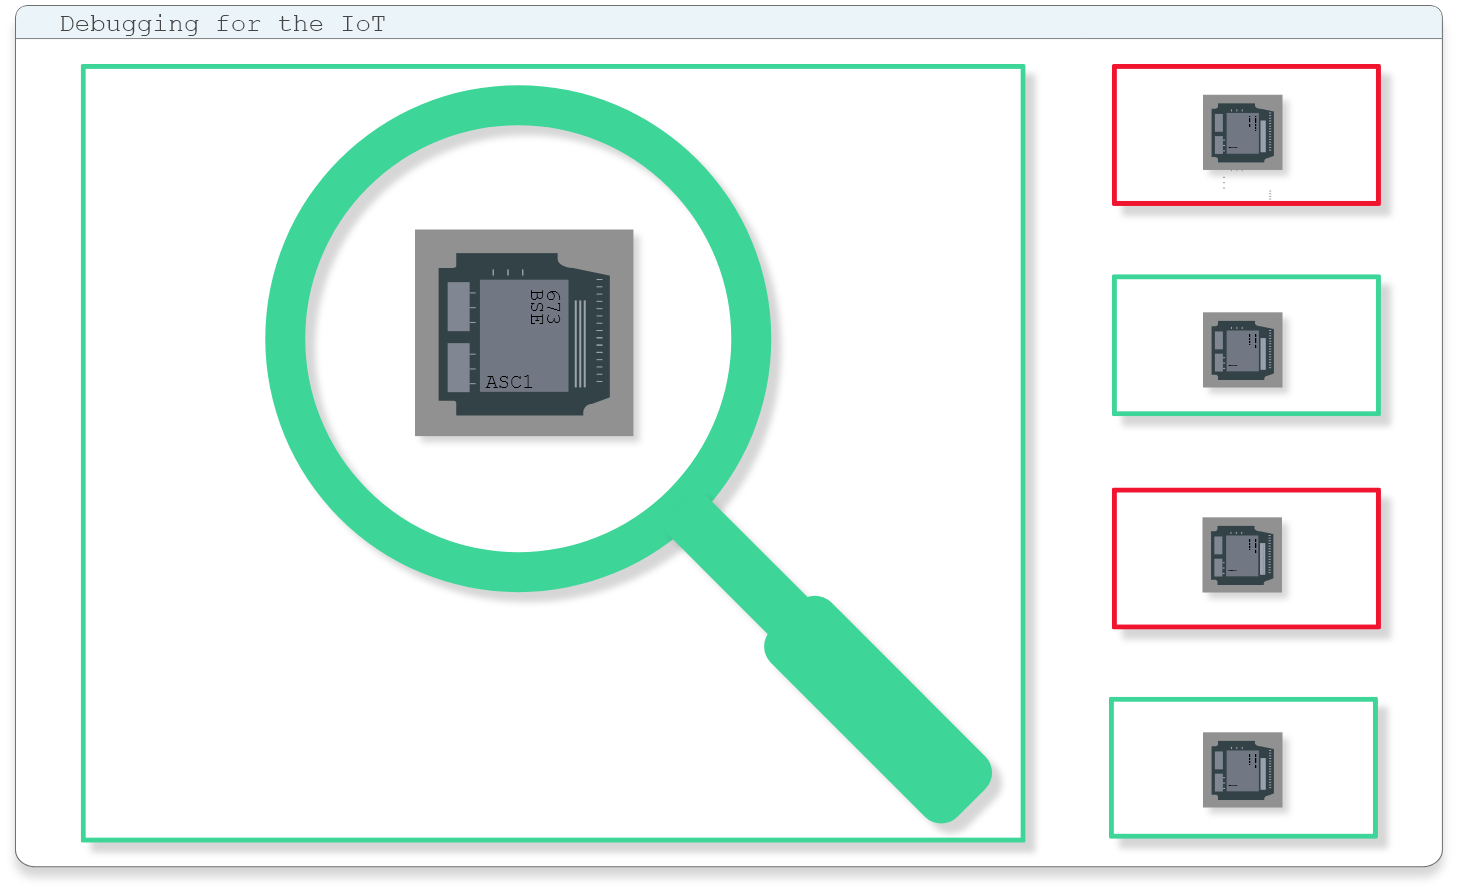
Debugging hardware can be a challenging task with IoT devices as there is a lack of consistent connections and devices that have limited performance. There are several tips and tricks that can make it easier. Here are some strategies to try out:
1. Use the right tools and interfaces
The first time we notice a device is failing, the information on why it is failing is normally limited. It may be a tester who noticed the entire device has stopped functioning or even worse, it is an irate customer whose device has just malfunctioned. In both scenarios, we do not have the information that is needed to make any useful diagnostics.
Therefore, at the design stage, it is crucial to decide exactly what the debugging procedure will be when a bug is inevitably discovered. This procedure will include the usage of certain tools and interfaces and will vary from checking the electronic signals on the embedded device using oscilloscopes to checking the embedded software through an interface such as JTAG or through a remote SSH connection.
2. Expect failures and have robust logging
Related to our first point, we should always do our best to ensure that released software is bug free, but inevitably a bug will occur. When this happens, we need as much information as to why an error occurs and we need to prepare for this at the development stage.
The most basic of these is to ensure that all debug information from an error is properly stored within the logs. The next stage is for significant events to be properly logged and stored. These may include, when a new update was received, sensor readings, communications with the cloud and device temperature readings. It is important to consider what environment the IoT device will run in and find ways of logging failures that are likely in that place.
3. Use automation and continuous integration (CI)
Continuous Integration is the process of automating the building testing of code every time a code change is made. This helps to detect errors as soon as a code change is made and prevents them from propagating.
Debugging and CI work hand in hand. Debugging helps identify errors, while CI helps to prevent errors from occurring in the first place. Both processes help ensure that the code is working as expected and that any errors are quickly identified and addressed.
BeetleboxCI provides a CI platform built specifically for smart, embedded devices. We are currently providing a free trial, which can be found here.
4. Enable devices to automatically flag issues
In many cases, it is not enough to wait for a user to identify an issue. Instead, it can be much more effective for devices to self-report errors and issues as they arise.
For instance, a particular process may fail and the device may report the error to the central server. The server is the able to report the error to the administrators, who can then work on a fix before the user has even noticed.
5. Have robust over-the-air (OTA) updates
Once an issue is detected, either through an automatic flag or through a user report, teams need to be able to respond with a solution. Using the other points, we have the diagnostic data we need, but once a solution is found we need a way of securely rolling out that solution across devices.
Over-the-air updates is an important procedure that all teams must think about at the design stage of the device. It is necessary to consider how all parts of the embedded software can be updated from the user application down to the firmware itself.
Many teams will develop their own solution, but also consider using open-source firmware updates, such as mender.io. Container based software like balena.io are also becoming increasingly popular.
Using these five tips can help alleviate the difficulties engineers face when debugging their IoT software. Ultimately, effective debugging comes from expecting errors to occur from the very beginning and having a strong diagnostics procedure followed by a stable, predictable OTA solution.
If you are looking to setup automated pipelines as part of your debugging solution, BeetleboxCI is currently running a free, one-month trial. Let us know what you have done to debug IoT solution in the comments below!


